Mitsubishi P91DW User Manual Page 117
- Page / 206
- Table of contents
- BOOKMARKS
- AlphaImager™ IS-2200 1
- For Windows 2000/XP 1
- AlphaImager 2
- 2200 – 2
- AlphaEaseFC User’s Manual 2
- 1.2.1 System Components 8
- 1.2.2 System Placement 8
- 1.2.3 Cable Connections 8
- 1.5 System Information 15
- 1.6 Acquiring an Image 16
- 1.6.1 Focusing on an Image 17
- Selecting a Filter 21
- Displays 23
- Imaging Functions 32
- 2.1 Contrast Adjustment 33
- Black Level Adjustment 34
- White Level Adjustment 35
- Gamma Setting Adjustment 35
- The Auto Contrast Selection 36
- The Reverse Button 37
- The Grid Button 37
- 2.2 Tool Bar 40
- Sample Printouts 42
- 2.3 Tool Box 43
- 2.4 Status Bar 43
- Chapter 3: Drop Down Menus 46
- File Open 47
- File Overlay 48
- File Close 48
- File Save and Save As 49
- File Types: 50
- Chapter 3: Drop Down Menus 52
- 3.2 The Edit Menu 53
- Reset and Clear 54
- 3.3 The Image Menu 55
- Conversion 56
- Flat Field Calibrate 57
- 3.4 The Setup Menu 59
- Load Defaults 60
- Preferences 63
- 3.5 The Overlay Menu 66
- 3.6 The Utilities Menu 69
- Notepad 70
- 3.7 The View Menu 71
- Zoom Functions 72
- Show Annotations 72
- 3.8 The Help Menu 73
- Chapter 4: The Image 76
- 4.2 The Rotate / Flip Tool 77
- 4.3 Histogram 78
- 4.4 Automatic Enhancement 79
- 4.5 Annotations 81
- Chapter 4: Enhancement Tools 82
- Text Background and Font 83
- Text Angles 84
- The Drawing Tools 84
- The Editing Tools 86
- 4.6 False Color 88
- Palettes 2 through 11 89
- 4.7 Image Filters 90
- Sharpening Filters 92
- 3-D (Contour) Filters 92
- Noise Filters 93
- Smoothing Filters 93
- Edge Filters 93
- Horizontal Edge Filter 93
- Vertical Edge Filter 94
- Custom Filter 94
- The UNDO Button 94
- Examples of Filter Results 94
- 4.8 Movie Mode 95
- Frame Stacking 98
- BLANK PAGE 100
- Tools in the Toolbox 102
- Setting up an ARRAY Template 103
- Aligning the Template 104
- Measuring Density 105
- The INVERT Box 106
- Outputting Data 106
- Output Dialog Box 107
- Introduction 108
- Chapter 5: Analysis Tools 110
- Manually Selecting Bands 111
- Automatic Band Finding 111
- Special Functions: 115
- Snap to Peak 115
- The INVERT Button 115
- Calculating R 116
- Values 116
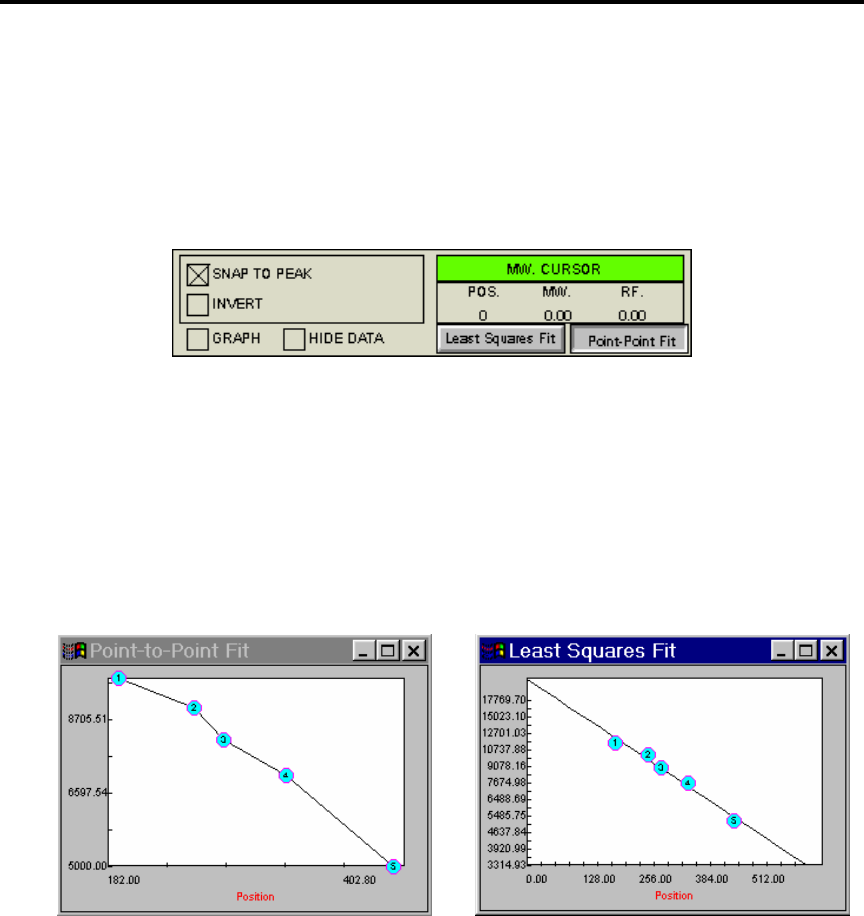
- The Graph Tool 117
- Auto Grid 118
- Setting up the Lane Template 119
- Specifying the Scan Width 120
- Scanning the Image 121
- Graph Display 122
- The Active Graph 122
- The Data Window 123
- Peak Detection Algorithms 125
- Set parameters dialog box 129
- Reset Base 130
- Base Subtract 130
- Interpreting 1D-Multi Data 130
- V. Line 130
- 3-D View 131
- Smooth Data 131
- The Invert Button 132
- Overlaying Graphs 133
- 1D-Multi 134
- Band Scoring 139
- Outputting Quantitative Data 141
- Exporting Graphs 141
- Exiting 1D-Multi 142
- Auto Lane 142
- Black Bands or White Bands 142
- Sensitivity Adjustment Bar 143
- Area of Interest Drawing 143
- Output Data 146
- Baseline 147
- Options 147
- Editing Peak Boundaries 147
- Auto Lane Editing Features 148
- Manual Band Matching 156
- Band Matching Results 157
- 5.4 Spot Density Tools 161
- Magic Wand and AutoSpot 163
- Magic Wand: 163
- Magic Wand Sensitivity 163
- Area of Interest 165
- Bright Spot vs Dark Spot 166
- Find Spots 166
- Background Threshold 166
- Moving Objects 168
- Deleting Objects 168
- Saving and Loading Objects 168
- Object Libraries 169
- Spot Density Measurements: 169
- Data Definitions 170
- Inverting the Data 170
- No Background 171
- Automatic Background 171
- Manual Background 172
- The Standard Curve Toolbox 173
- Displaying the Curve 175
- Outputting Quantitation Data 176
- Manual Count Tools 177
- Auto Count Tools 177
- Manual Count 179
- Automatic Count 180
- Editing Tools 182
- Displaying Spots 183
- Using the ADD SPOT Tool 183
- Using the Erase Spot Tool 184
- Spot Count Data 184
- Outputting Auto Count Data 185
- 5.6 The Scoring Function 187
- Scoring the Sample 188
- 5.7 The Ruler Function 190
- Appendix A: Opening 192
- AlphaEaseFC Files 192
- Weight Library Files 194
- To Change the Security Setup 196
- Security Features Dialog Box 197
- Instructions 202
- Cabinet Setup 203
- Camera Installation 206
Related products and manuals for Print & Scan Mitsubishi P91DW
 (2 pages)
 (2 pages)
© 2020, manymanuals.com. All rights reserved. | 2.418 s |
 Manymanuals.com
 Manymanuals.de
 Manymanuals.fr
 Manymanuals.it
 Manymanuals.pl
 Manymanuals.cz
 Manymanuals.es
 Manymanuals-pt.com
Comments to this Manuals